
Introduction
As organizations increasingly rely on containerized applications, ensuring their performance, stability, and reliability becomes a critical task. Docker makes it easy to package and deploy applications, but without proper monitoring, you may miss vital insights into how your containers are behaving. Issues such as resource exhaustion, unexpected crashes, or networking bottlenecks can quickly escalate if left unnoticed.
This is where Prometheus, an open-source monitoring and alerting toolkit, comes into play. Prometheus is designed to collect, store, and query time-series metrics, making it an excellent fit for containerized environments. When paired with Docker, it gives you the ability to:
- Track resource usage (CPU, memory, disk, network) of your containers in real time.
- Detect and troubleshoot performance bottlenecks before they affect users.
- Enable alerts for abnormal behavior or failures.
- Provide historical data to help understand trends and plan for scaling.
- Integrate seamlessly with visualization tools such as Grafana for clear, actionable dashboards.
By setting up Prometheus to monitor Docker, you establish a foundation for observability that not only improves day-to-day operations but also builds confidence in your system’s resilience. In this post, we will walk through how to configure Prometheus to collect Docker metrics and show you how this setup can be the backbone of a reliable monitoring strategy.
Getting our Prometheus up and running
Nowadays, getting a Prometheus instance up and running is simpler than it sounds. Thanks to Docker itself we can get our instance deployed and ready to be queried in seconds. Let’s see an example of a docker-compose file.
# docker-compose.yml
version: "3.8"

services:
  prometheus:
    image: prom/prometheus:latest
    container_name: prometheus
    restart: unless-stopped
    ports:
      - "9090:9090"
    volumes:
      - ./prometheus.yml:/etc/prometheus/prometheus.yml:ro
      - prometheus_data:/prometheus

volumes:
  prometheus_data:
We can create also a small configuration for starting collecting Prometheus own metrics
# prometheus.yml
global:
  scrape_interval: 15s

scrape_configs:
  - job_name: "prometheus"
    static_configs:
      - targets: ["localhost:9090"]
Now if we run docker compose up -d we will have our instance serving traffic on port 9090
$ docker ps

CONTAINER ID   IMAGE                    COMMAND                  CREATED         STATUS         PORTS                                         NAMES
6416f7540370   prom/prometheus:latest   "/bin/prometheus --c…"   9 seconds ago   Up 9 seconds   0.0.0.0:9090->9090/tcp, [::]:9090->9090/tcp   prometheus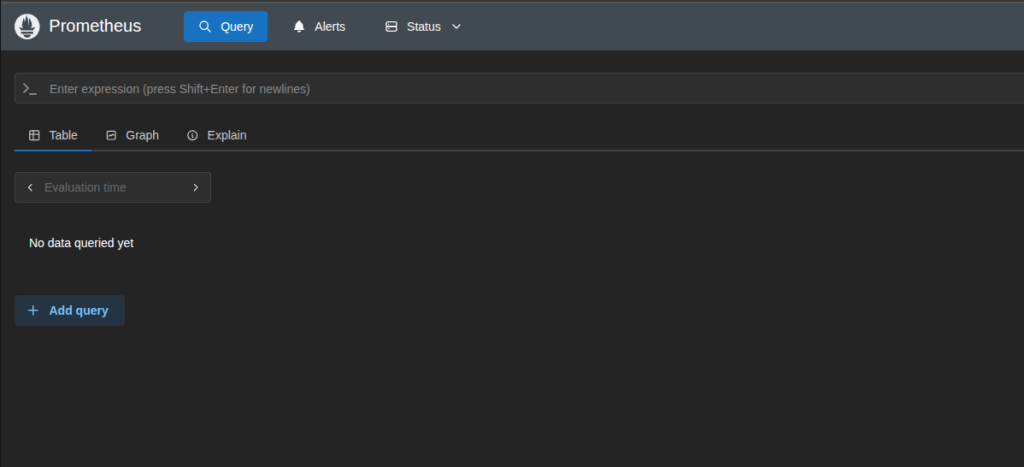
Preparing Docker for exporting the metrics
Now it’s important to understand that we are gonna monitor docker itself, not the applications running with Docker.
Docker has a new feature to expose metrics on Prometheus-like format of the Docker server without being force to expose the whole Docker API, which is a win on security. To do that, we need to enable metrics-addr: on the deamon.json.
Thanks to that, Prometheus will be able to read and store our metrics.
# /etc/docker/daemon.json
{
  "metrics-addr": "0.0.0.0:9323"
}
After adding that, we will need to restart docker.
Now that we are exposing the metrics, we would be able to see them on the specified port and /metrics path
$ curl localhost:9323/metrics

# HELP builder_builds_failed_total Number of failed image builds
# TYPE builder_builds_failed_total counter
builder_builds_failed_total{reason="build_canceled"} 0
builder_builds_failed_total{reason="build_target_not_reachable_error"} 0
builder_builds_failed_total{reason="command_not_supported_error"} 0
builder_builds_failed_total{reason="dockerfile_empty_error"} 0
builder_builds_failed_total{reason="dockerfile_syntax_error"} 0
builder_builds_failed_total{reason="error_processing_commands_error"} 0
builder_builds_failed_total{reason="missing_onbuild_arguments_error"} 0
builder_builds_failed_total{reason="unknown_instruction_error"} 0
# HELP builder_builds_triggered_total Number of triggered image builds
# TYPE builder_builds_triggered_total counter
builder_builds_triggered_total 0
# HELP engine_daemon_container_actions_seconds The number of seconds it takes to process each container action
# TYPE engine_daemon_container_actions_seconds histogram
engine_daemon_container_actions_seconds_bucket{action="changes",le="0.005"} 1
engine_daemon_container_actions_seconds_bucket{action="changes",le="0.01"} 1
engine_daemon_container_actions_seconds_bucket{action="changes",le="0.025"} 1
engine_daemon_container_actions_seconds_bucket{action="changes",le="0.05"} 1
engine_daemon_container_actions_seconds_bucket{action="changes",le="0.1"} 1
engine_daemon_container_actions_seconds_bucket{action="changes",le="0.25"} 1
engine_daemon_container_actions_seconds_bucket{action="changes",le="0.5"} 1
engine_daemon_container_actions_seconds_bucket{action="changes",le="1"} 1
engine_daemon_container_actions_seconds_bucket{action="changes",le="2.5"} 1
engine_daemon_container_actions_seconds_bucket{action="changes",le="5"} 1
engine_daemon_container_actions_seconds_bucket{action="changes",le="10"} 1
Telling Prometheus where to scrape
Now that we have Prometheus up and running and Docker exporting its metrics, it’s time to tell Prometheus were to look and scrape for the metrics, so later we can navigate through them.
In order to tell Prometheus where are the metrics, we need to modify the prometheus.yml file that we created during the first steps. We need to create a new job and specify the address. Our file should look like this now:
# prometheus.yml

global:
  scrape_interval: 15s

scrape_configs:
  - job_name: "prometheus"
    static_configs:
      - targets: ["localhost:9090"]
  - job_name: 'DockerStats'
    static_configs:
      - targets: ['172.17.0.1:9323']
Note 1: Even on the
curlcommand we specified the/metricspath, here it’s not needed. By default, Prometheus will scrape on that path.
Note 2: Please, be careful of the target. 127.0.0.1 or
localhostwon’t work. Metrics are exposed on the docker bridge network which you can get from network interfacedocker0ip a | grep docker0 7: docker0: mtu 1500 qdisc noqueue state DOWN group default inet 172.17.0.1/16 brd 172.17.255.255 scope global docker0
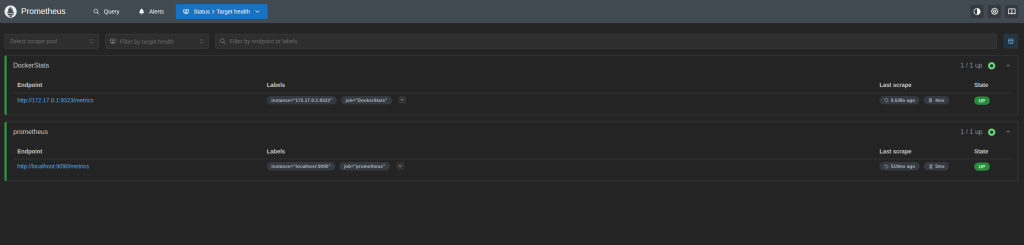
Now we cand go to our Prometheus instance and we will see our job scraping the metrics correctly on /targets path.
Next Steps
That enables us for a vast options to explore our metrics and get to know better the state of our Docker service. As for example, we could use Prometheus as a Dataset on Grafana to visualize all the stats and a more beautiful way, and even create alerts based on thresholds.